Advanced Reports 2.6 Introduces a Brand-New Reports Dashboard
Categorized as : Magento 2 Extensions
Any online business, even a small or starting one, needs to deal with a huge amount of information, but staring and seeing, are two completely different things.

The data a merchant has as a result of its daily sales and other activities are so abundant that they need not only to be collected properly, but also arranged in the way, which would allow merchants to correctly interpret they, discover valuable insights, and make efficient decisions.
Today, we’d like to present you our new enhanced Advanced Reports extension for Magento 2 stores, which pays a great deal of attention to the reports usability, clarity, and meaning. Still, the latest Advanced Reports 2.6 has even more to offer, and the major feature of it is the new reports Dashboard.
The dashboard has 10 widgets in total, including 8 numerical widgets and 2 charts. A Magento admin can easily change their content according to their business needs and display any of the provided by the extension reports there. The drop-down changing the content is located in the top right corner of each widget.

The chart widgets have all the same configuration options as the numerical ones, but additionally display diagrams, making the provided information perceived much better.
By default, all the widgets of the dashboard are in the comparison mode and show two sets of data, related to the main and comparison time ranges. This makes the provided information even more valuable and meaningful.
For your convenience, the dashboard saves all the current settings, including the selected reports displayed by widgets and time ranges, so you should not set them again each time you enter the dashboard page. Moreover, you can save different dashboard views as bookmarks and switch among them to get a complete picture of your performance.
Besides the provided by the module reports to be selected as a basis for a particular widget, the latest version allows you to forecast your monthly sales in terms of sales and items ordered. The eighth numeric widget outlined with the blue line is devoted to this very purpose.
Its specific drop-down has only two options - Forecast: Total and Forecast: Items Ordered. Using the formula based on average daily sales it allows you to estimate your future performance within the current month.
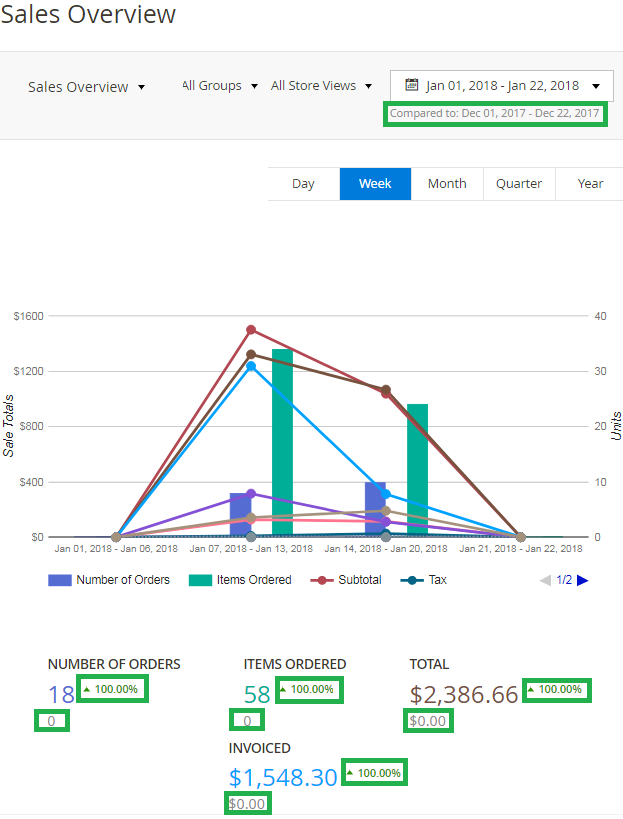
The information of your business performance provided by the Advanced Reports extension would be incomplete without the opportunity to compare your sales, numbers of orders, customers, refunds, etc. with some particular landmarks you consider representing your previous successes or falls. The previous versions of the extension made comparisons available for only a few reports, while now you can take advantage of them everywhere.

Comparisons are provided in total highlights and charts with the compared data mostly presented in gray for numeric values and with pale colors for bars.
Meanwhile, the comparison rates are green in the case of growth and red in the case of decline. By default, the rates are displayed in percents but turn into absolute terms of the same colors on mouse hovers.
Advanced Reports 2.6 has also brought several new charts at your disposal, including the ones for the Sales by Payment Type, Sales by Manufacturer, Traffic and Conversions, and Product Conversion reports.
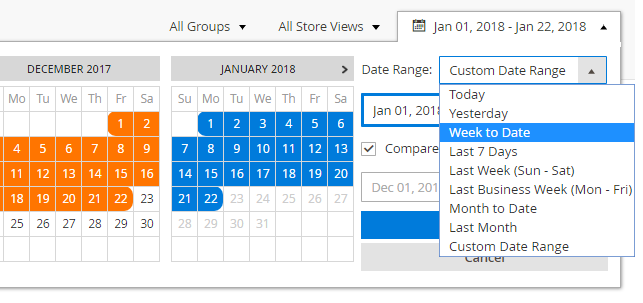
As we mentioned above, the latest version of the extension is highly equipped with the comparison functionality, so we’ve also added several new time ranges to adjust it to any particular situation and need.

The Week to Date and Month to Date time ranges allow you to easily select the current week or current month time periods for your reports in just one click.
Note: For comparison purposes, the Month to Date time range takes the whole previous month, even if the number of days of the current and compared months is not equal.
Almost all the charts presented by the extension now have two axes. The first one is usually in monetary terms, while the secondary axis shows the number of orders, items ordered, conversion rates, etc.
Most generally, the latest update enhances the overall experience with the provided reports and unveils some new opportunities to read and consolidate the provided data. It significantly improves the usability of the extension and allows you to make decisions much faster, which is extremely important in the current fast-paced ecommerce environment.
You can purchase or update Advanced Reports 2.6 in our store or try it in action in our demo stores. For more information on the provided functionality please refer to the extension user guide.
We also highly appreciate your customer feedback and our team is looking forward to hearing from you on your experience with the extension.

The data a merchant has as a result of its daily sales and other activities are so abundant that they need not only to be collected properly, but also arranged in the way, which would allow merchants to correctly interpret they, discover valuable insights, and make efficient decisions.
Advanced Reports 2.6 Functionality
Today, we’d like to present you our new enhanced Advanced Reports extension for Magento 2 stores, which pays a great deal of attention to the reports usability, clarity, and meaning. Still, the latest Advanced Reports 2.6 has even more to offer, and the major feature of it is the new reports Dashboard.
Advanced Reports Dashboard
The dashboard has 10 widgets in total, including 8 numerical widgets and 2 charts. A Magento admin can easily change their content according to their business needs and display any of the provided by the extension reports there. The drop-down changing the content is located in the top right corner of each widget.

Reports Dashboard
The chart widgets have all the same configuration options as the numerical ones, but additionally display diagrams, making the provided information perceived much better.
By default, all the widgets of the dashboard are in the comparison mode and show two sets of data, related to the main and comparison time ranges. This makes the provided information even more valuable and meaningful.
For your convenience, the dashboard saves all the current settings, including the selected reports displayed by widgets and time ranges, so you should not set them again each time you enter the dashboard page. Moreover, you can save different dashboard views as bookmarks and switch among them to get a complete picture of your performance.
Forecast Dashboard Widget
Besides the provided by the module reports to be selected as a basis for a particular widget, the latest version allows you to forecast your monthly sales in terms of sales and items ordered. The eighth numeric widget outlined with the blue line is devoted to this very purpose.
Its specific drop-down has only two options - Forecast: Total and Forecast: Items Ordered. Using the formula based on average daily sales it allows you to estimate your future performance within the current month.
Data Comparisons
The information of your business performance provided by the Advanced Reports extension would be incomplete without the opportunity to compare your sales, numbers of orders, customers, refunds, etc. with some particular landmarks you consider representing your previous successes or falls. The previous versions of the extension made comparisons available for only a few reports, while now you can take advantage of them everywhere.

Comparison Functionality
Comparisons are provided in total highlights and charts with the compared data mostly presented in gray for numeric values and with pale colors for bars.
Meanwhile, the comparison rates are green in the case of growth and red in the case of decline. By default, the rates are displayed in percents but turn into absolute terms of the same colors on mouse hovers.
New Charts
Advanced Reports 2.6 has also brought several new charts at your disposal, including the ones for the Sales by Payment Type, Sales by Manufacturer, Traffic and Conversions, and Product Conversion reports.
New Time Ranges
As we mentioned above, the latest version of the extension is highly equipped with the comparison functionality, so we’ve also added several new time ranges to adjust it to any particular situation and need.

New Time Ranges
The Week to Date and Month to Date time ranges allow you to easily select the current week or current month time periods for your reports in just one click.
Note: For comparison purposes, the Month to Date time range takes the whole previous month, even if the number of days of the current and compared months is not equal.
Dual Y-axis Charts
Almost all the charts presented by the extension now have two axes. The first one is usually in monetary terms, while the secondary axis shows the number of orders, items ordered, conversion rates, etc.
Conclusion
Most generally, the latest update enhances the overall experience with the provided reports and unveils some new opportunities to read and consolidate the provided data. It significantly improves the usability of the extension and allows you to make decisions much faster, which is extremely important in the current fast-paced ecommerce environment.
You can purchase or update Advanced Reports 2.6 in our store or try it in action in our demo stores. For more information on the provided functionality please refer to the extension user guide.
We also highly appreciate your customer feedback and our team is looking forward to hearing from you on your experience with the extension.


