
Magento 1 vs. Magento 2: Two Sides of the Same Coin
Categorized as : Ecommerce
Magento remains the universal e-commerce solution for the online businesses operating in various industries.
Though more and more merchants prefer to install Magento 2 on their web stores, Magento 1 is still widely used in the e-commerce field. In this article, we will examine the profiles of Magento 1 and Magento 2 and determine their current market positions.
Study Description
In this study, we performed a comparative analysis of the Magento 1 (M1) and Magento 2 (M2) based web stores by six parameters:
- Languages;
- Countries (physical locations);
- Product types;
- Average product prices;
- Average loading times;
- Average Google PageSpeed Insights results.
All the data for the research was obtained from the representative samples built upon the related M1 and M2 databases. In our study, we used the Pingdom Website Speed Tool for testing the loading time and the Google PageSpeed Insights tool to determine the average desktop and mobile optimization rates.
Study Results
Web Stores by Languages
In terms of language usage, Magento 2 is more diversified than its predecessor. Still, English is the most popular language for both the M1 and M2 stores – 76% and 72% correspondingly.
Diagram 1. M1 and M2 Stores by Languages
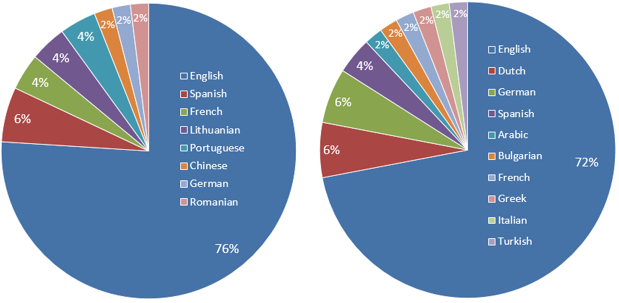
In Spain, the e-commerce activity continues to grow, and for now, the Spanish language is used by 6% of the M1 stores and 4% of the M2 stores accordingly.
French is another widely used language which is largely preferred by the M1 users – 4% of the market share. Still, the share of this language in the M2 market is less significant – 2%.
The Lithuanian and Portuguese languages are mostly preferred by M1 stores – 4% for each language correspondingly. This fact proves that for these two regions, the latest solutions offered by Magento 2 do not seem to be necessary to implement as soon as possible. Thus, they are more likely to use time-proven solutions. On the other hand, the Dutch and German-speaking regions are in the constant pursuit of innovations, so their M2 market share is 6% for each language correspondingly.
Now, let’s consider how the M1 and M2 based web stores are distributed across the countries.
Web Stores by Countries
In terms of physical locations of web stores, both M1 and M2 are the highly diversified e-commerce solutions with the US as the dominant region – 50% of the M1 market share and 32% of the M2 market share accordingly. This situation is quite predictable, as the US is considered as the largest e-commerce market in the world.
Diagram 2. M1 and M2 Stores by Countries
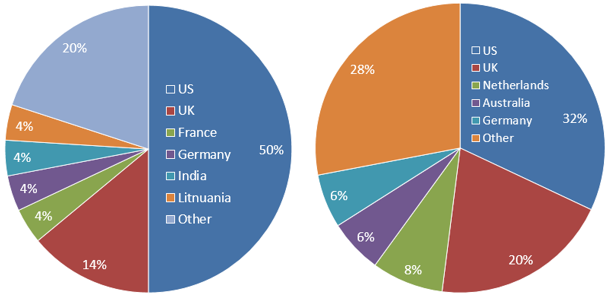
The second largest region is the UK – 14% for the M1 stores and 20% for the M2 stores accordingly.
France is the region that continues to implement more traditional M1 solutions and only begins to adopt M2 for its stores. Therefore, this region has 4% of the M1 market share and 2% of the M2 market share correspondingly.
Currently, the web stores in Germany are in the process of active migration from M1 to M2, which is proved by the fact that German stores still have a notable share on the M1 market – 4%, while the M2 stores already take 6% of the market.
India and Lithuania remain the countries in which the e-commerce industry develops quite rapidly. Thus, these two regions equally have 4% of the M1 market share. It’s noteworthy that India begins to penetrate the M2 domain and now, it has 2% of the market share.
The Netherlands and Australia actively adopt the solutions of Magento 2 for their websites since the appearance of this platform. Currently, these regions occupy a considerable part of the M2 market with the 8% share for the Netherlands and 6% for Australia.
The shares of other regions in both the M1 and M2 markets are not significant. Now, let’s find out what product types are sold by M1 and M2 based stores.
Web Stores by Product Types
The web stores that sell Outdoor Products dominate the M1 market with 12% of the market share, while the M2 market is dominated by the Clothing stores – 18% of the market share. One should note that the stores selling Outdoor Products began to actively penetrate the M2 market, and now they have 8% of the M2 market share.
Diagram 3. M1 and M2 Stores by Product Types
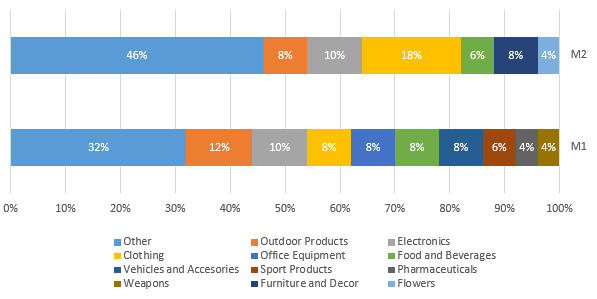
The web stores that sell Electronics are evenly distributed between both the M1 and M2 markets with the 10% market shares.
It’s noteworthy that Clothing web stores still have a considerable share of the M1 market – 8% as well as the M1 web stores selling Vehicles and Accessories, Office Equipment, and Food and Beverages (8% of the M1 market share for each). On the M2 market, the share of these product types is not yet notable.
Furniture and Décor web stores actively use the latest solutions of M2 which resulted in 8% of the M2 market share.
These figures prove that the M1 and M2 solutions suit well for the needs of various online business industries.
Web Stores by Average Prices
More “expensive” industries, such as Office Equipment, Electronics, and Weapons, tend to use M1 for their web stores – 950$, 800$, and 750$ average prices for the M1 stores accordingly. Still, the web stores that sell Electronics also have a significant average price rate on the M2 market – 850$. Another key player on the M2 market is the Furniture and Decor web stores with the 450$ average price rate.
Diagram 4. M1 and M2 Stores by Average Prices, USD
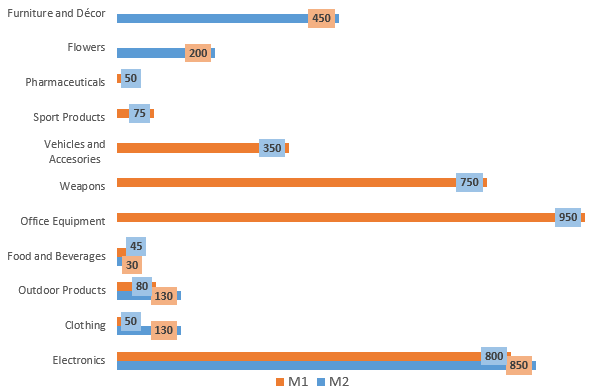
For other industries on the M1 market, the average price rates fluctuate between 50$ and 350$, while on the M2 market, they are between 30$ and 200$.
In general, the difference between the average price rates of the M1 and M2 web stores is not significant, however, these rates are slightly higher for the M1 stores – 350$, while for the M2 stores, it’s 298$.
Now, let’s move on to the next parameter of our comparative analysis – the average loading time of the M1 and M2 based stores by locations.
Average Loading Time of Web Stores by Locations
Using the Pingdom tool, we determined the average loading time of the M1 and M2 web stores tested from the next locations:
- Melbourne, Australia;
- San Jose, California, USA;
- Stockholm, Sweden.
The results of the analysis are presented in the table below.
Table 1. Average Loading Time of M1 and M2 Web Stores by Locations, sec.

As we stated in our previous studies, the physical affinity of a website to the host server notably influences the loading speed of the pages of this site. According to the study results, San Jose, USA is the region with the lowest average loading time rate for M1 web stores – 4,7 seconds. Probably, this might be explained by the fact that most of the M1 stores are located in the US.
Melbourne, Australia, in turn, is the region with the highest loading time of M1 web stores – 9,1 seconds.
It’s noteworthy that physical location might be not necessarily the determinant factor for the loading time of websites. Though most of the M2 stores are also located in the US, the region with the lowest loading time rate for this segment is Stockholm, Sweden – 6,1 seconds. The highest loading time rate again belongs to Melbourne, Australia – 10,4 seconds.
This situation might be explained by such a factor as the average internet speed in these regions. According to the latest research conducted by fastmetrics, Sweden takes the 3rd place in the top 10 list of the countries with the highest internet speed rates, while Australia is considered as the country with a quite slow internet.
In terms of total average loading time rates, the M1 websites are a bit faster than the M2 websites – 6,3 seconds against 7,9 seconds accordingly. In terms of page size, the M2 stores are also generally a bit heavier than the M1 stores.
Average Optimization Rate of Web Stores by Countries (on Desktop and Mobile Devices)
For this test, we took five countries with the largest market shares of the M1 and M2 stores separately and analyzed their websites by devices via the Google PageSpeed Tool. First, let’s consider the results for the M1 websites.
Table 2. Google PageSpeed Insights Results for M1 Stores by Countries

In terms of desktop optimization, Germany demonstrates the highest average rate – 68,5/100, while India has the lowest average rate – 29,5/100. Mobile versions of the M1 sites are better optimized in France – the 56/100 average optimization rate. Again, India demonstrates the worst result – the 24/100 average optimization rate.
On the other hand, Germany and France better optimize their sites for the newest technologies (as you might notice, in the table, Germany is the close second to France in terms of mobile optimization with the 53,5/100 average optimization rate).
On the M2 market, we have other leaders and underperformers. Let’s have a look at the table below.
Table 3. Google PageSpeed Insights Results for M2 Stores by Countries

Here, the US wins in terms of both desktop and mobile optimization – the 64,2/100 average optimization rate for desktop devices and the 58,7/100 rate for mobile devices.
As we stated earlier, the US is the largest e-commerce market that invests a lot in the development of this industry. The biggest number of top performing websites, well optimized for various devices, are located in this region.
In terms of both desktop and mobile optimization, Australia sadly occupies the last positions in these lists – the 23/100 average optimization rate for desktop devices and the 32/100 average rate for mobile devices.
Probably, these figures might also explain why Australia is the region with the highest loading time rate. According to the research conducted by Kissmetrics, the optimization of a website is one of the factors that significantly influence the loading time of website pages. In other words, Australia has the lowest average loading time rates, because most of the e-commerce websites located in this region are poorly optimized.
Finally, let’s consider the whole picture taking into account the total average optimization rates for both the M1 and M2 websites.
Table 4. Google PageSpeed Insights Results for M1 and M2 Web Stores by Devices

Both the M1 and M2 sites are better optimized for desktop devices than for mobile devices – the 56,2/100 average optimization rate for the M1 sites and the 51,5/100 rate for the M2 sites. Still, the difference between these rates is not significant.
Overall, despite the fact that the M1 sites are better optimized for both desktop and mobile devices than the M2 sites, these figures don’t look impressive in all cases. Probably, the site owners should devote more time to the desktop and mobile optimization issues.
Key Findings
- M1 and M2 are the highly diversified e-commerce solutions with the web stores in different languages located all over the world. Still, English is the most widely used language, and most of the M1 and M2 stores are located in the US.
- Though M2 is a more progressive solution compared to M1, there are still the countries, such as France, Lithuania, Portugal, India, and the like, that largely prefer to use the time-proven solutions of M1 for their web stores.
- Large business industries that sell expensive products mainly prefer to use M1 for their web stores. However, the average price rates between the M1 and M2 web stores are not significantly different – 298$ and 350$ accordingly.
- San Jose, California, USA, is the region with the fastest average loading time for the M1 websites – 4,7 seconds, while Melbourne, Australia has the highest average loading time rate – 9,1 seconds.
- Among the M2 websites, Stockholm, Sweden has the lowest average loading time rate – 6,1 seconds. Again, Melbourne, Australia is the region that demonstrates the worst result – 10,4 seconds.
- In terms of desktop and mobile optimization, the most user-friendly M1 sites are located in France and Germany, while India is the region which is characterized by the predominant number of poorly optimized M1 sites.
- The US is the country where the M2 sites are comparatively better optimized for both desktops and mobile devices, while in Australia, the M2 sites are weakly optimized.
- In general, the M1 websites are better optimized for various devices (the 56,2/100 average optimization rate for desktop devices and the 51,5/100 rate for mobile devices) than M2 sites (the 47,5/100 average optimization rate for desktop devices and the 47,3/100 rate for mobile devices).
Conclusion
The study shows that both the versions of the platform look similar, but have several distinct differences. Magento 2 doesn't seem to pave the same way and still suffers from the particular infant issues to be hopefully resolved in the nearest future.


