Magento 2 Subscription Reporting: Get Valuable Insights About Your Subscriptions
Categorized as : Ecommerce and Magento 2 Extensions
Nothing can help you understand and correct your businesses weaknesses better than a good old analysis. No matter what your business model, whether it's a subscription or a one-off model, you'll need valuable insights to make informed data-driven decisions.
Today we’ll talk about subscription analytics and its role in subscription businesses.
Why subscription metrics and reporting matter?
ECommerce is an ever-changing industry which requires constant improvements from businesses to acquire new customers and retain old ones. For it, it’s important to analyze business performance and adapt it to the current situation. Subscription business model due to its specific has unique metrics and KPIs that should be paid much attention to. Traditional analysis usually doesn’t cover it, that’s why a subscription reporting tool is essential for this type of business.
Taking it into consideration, we have updated our Magento 2 Advanced Subscription Products extension to add the integration with Magento 2 Advanced Reports. The integration allows merchants to track key subscription metrics to analyze the performance of their subscription business.
The freshly added subscription analytics consists of the following reports:
- Initial vs Recurrent Sales Report
Average Revenue Per Customer Report
Churn Rate Report
Growth Rate Report
Number of Active Subscribers Report
Monthly Recurring Revenue Report
Lifetime Value Report
Let’s talk about each report in more detail.
Initial vs Recurrent Sales Report
Initial and Recurring sales is a key metric of subscription business. It helps businesses to analyze business performance for a specific period of time. The report reflects the following subscription metrics:
- Initial Orders - the number of first orders made in a determined period of time.
- Initial Qty - the number of items ordered for the first time in a determined period of time.
- Initial Total - the total revenue for initial orders in a determined period of time.
- Initial Invoiced - the revenue already earned for initial orders in a determined period of time.
- Recurrent Orders - the number of subsequent orders made in a determined period of time.
- Recurrent Qty - the number of items ordered repeatedly in a determined period of time.
- Recurrent Total - the total revenue for recurrent orders in a determined period of time.
- Recurrent Invoiced - the revenue already earned for recurrent orders in a determined period of time.
All the data in the report can be filtered according to the store view and customer segment. What’s more, in a calendar it’s possible to specify a date or date range to serve your purposes. For example, reports based on a specific week and month period can help you reveal the immediate effects of the promotion campaign or price changes. A yearly period will help you analyze business health and make financial forecasts.

Average Revenue Per Customer Report
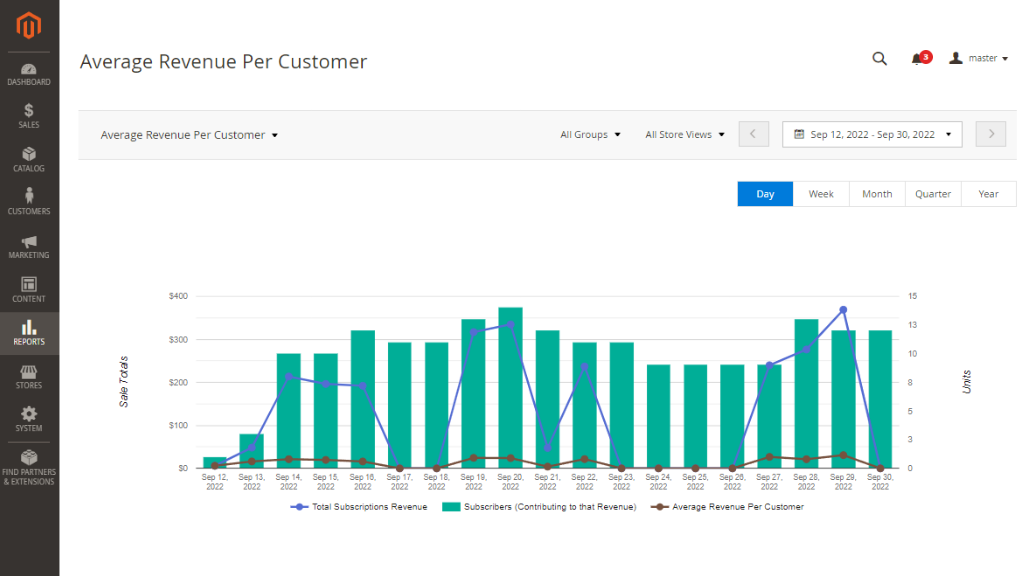
The Average Revenue Per Customer Report (ARPC) displays the total subscription revenue for a specific period of time divided by the total number of customers.
As the revenue is unstable metrics, which can change due to discounts, plan changes, (un)installs and other factors, it can be challenging to calculate it and make accurate forecasts.
ARPC simplifies and speeds up the task. This subscription report shows the Total Subscriptions Revenue by date and the number of Subscribers having contributed to that sum to identify the average profit each customer has brought for a period of time. In this way we have a more precise figure which takes all price and sales fluctuations into account.
Churn Rate Report
Churn is not only an unpleasant phenomenon every business has to face one day, it’s also a driver of progress. It’s a churn that makes a company develop, invent more interesting products or features, and experiment with promotion campaigns to acquire new customers.
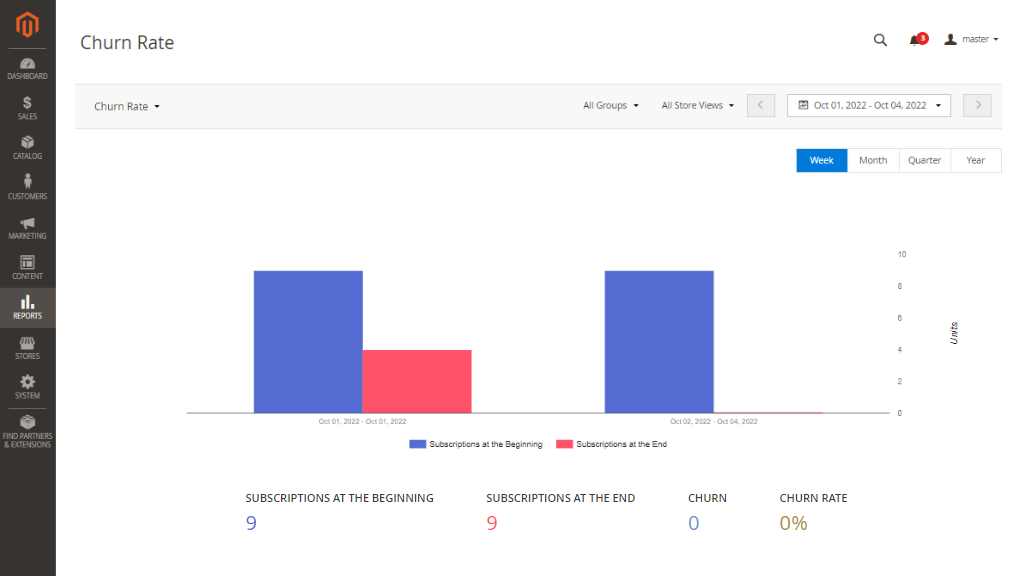
Churn rate reflects an eCommerce store loss in subscribers for a given period of time. It is measured the following way: the number of subscriptions at the beginning of the period is divided by the number of subscriptions at the end of the period out of those who were present at the beginning and all it is multiplied by 100%.
For example, at the beginning of the month there were 3 subscribers: Kate, Peter and Ingrid. At the end we saw that only Kate and Peter were left, while Ingrid had unsubscribed. It means that a churn rate for this period is 33%. Even if at the end of the month we saw that two more customers had subscribed, they were not calculated as they hadn't been present at the beginning of the period.
The report goes even deeper than just showing the rate, it allows store admins to specify a customer group and store view so that to identify the weak points of your strategy and sustain growth goals.
Growth Rate Report
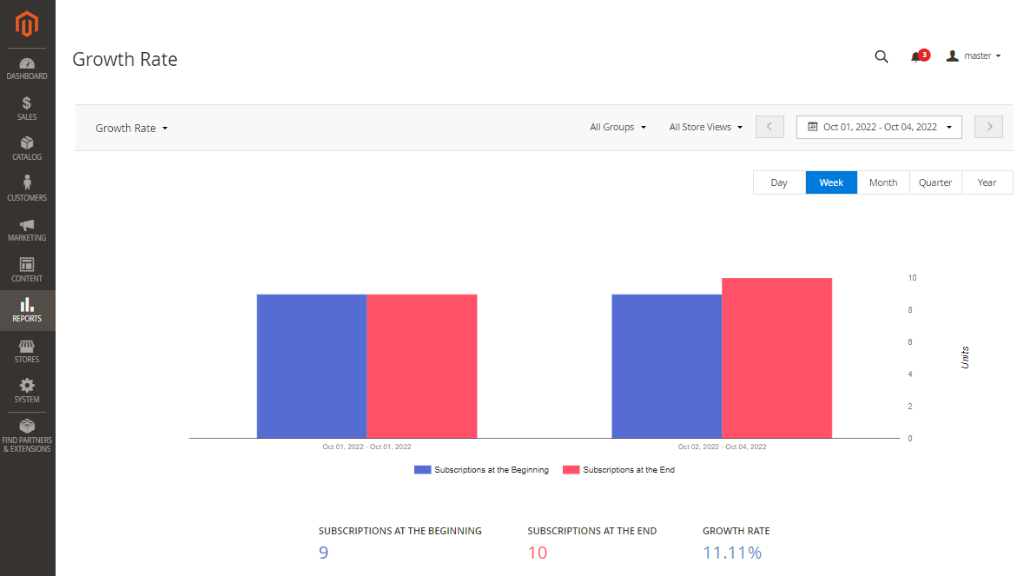
Opposite to the Churn rate is Growth rate, which shows how many new subscriptions the business managed to get for a determined period of time. The rate is calculated the following way: the total amount of all active subscriptions at the end of the period is divided by the total amount of active subscriptions at the end of the period.
The report reflects not only the subscriptions sales growth but also the number of subscriptions at the beginning of the period and at the end of the period. It also provides convenient filtering options to specify store view and customer group for more deep analysis.
This is a key report for subscription businesses which is taken into account when making important business decisions.
Number of Active Subscribers Report
For eCommerce businesses it’s important to track active users. Due to its specifics a subscription business has more stable figures than one-off stores, however it’s still important to track subscribers to better understand business performance and make data-driven financial forecasts.
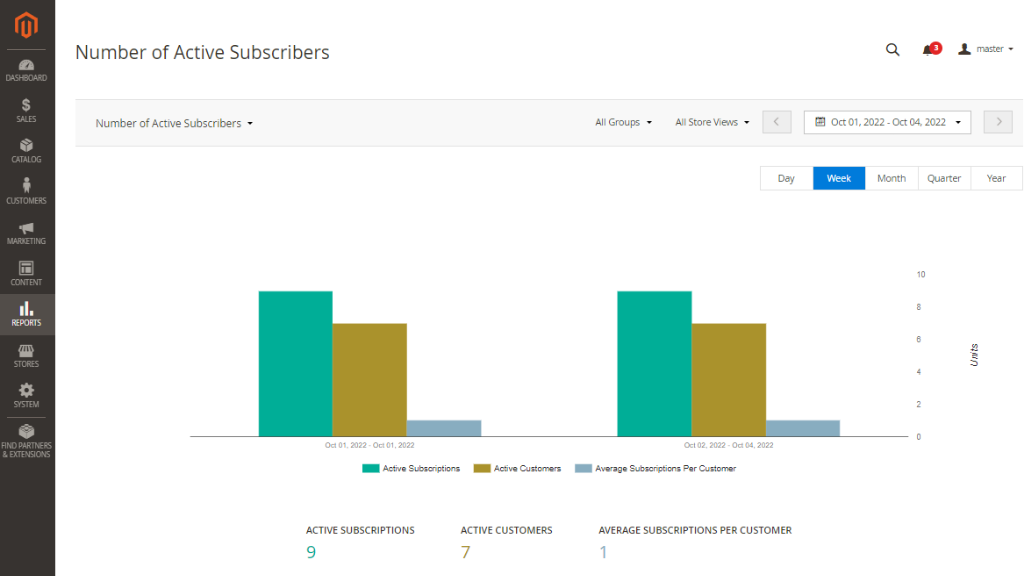
The report shows the amount of active subscriptions, active customers and average subscriptions per customer. The last metrics is calculated by dividing the number of profiles to the number of customers.
Same as the previous ones, in the report you can specify the period of time, store view and customer group.
Monthly Recurring Revenue Report
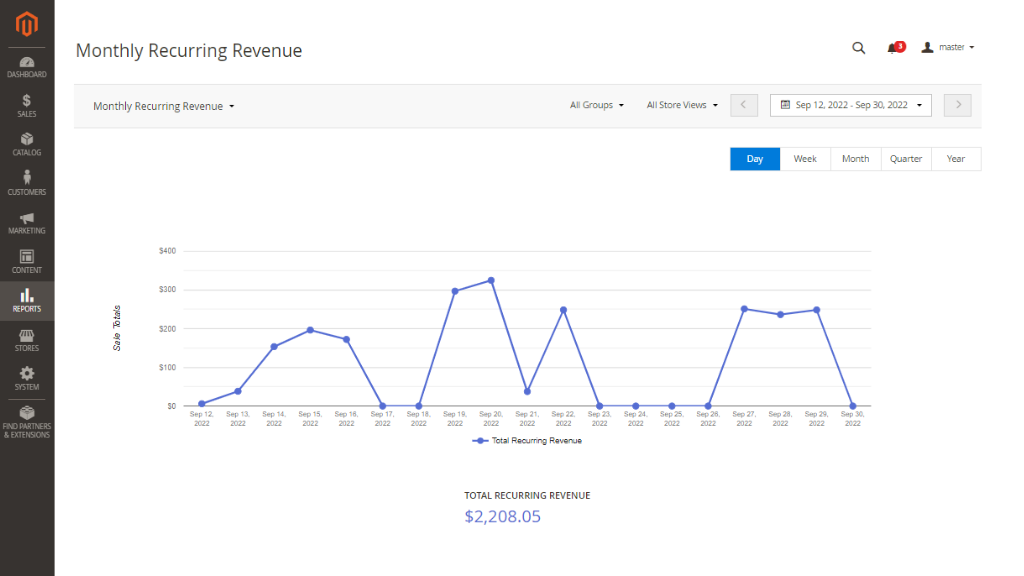
To see how much revenue subscriptions generate each month, Monthly Recurring Revenue (MRR) report is essential. It helps to identify if the subscription business is growing in terms of revenue and forecast future sales, the approximate inventory demand, etc. It’s important to mention that the initial fee is not included in the calculation, only recurring payments are counted.
MRR is considered to be a report which helps subscription businesses to meet their growth goals. The report provides date, store view and customer group filters for more specific analysis.
In addition to it, the table below the graph shows Total Recurring Revenue and Total Initial Fee per date in a chosen period of time.
Lifetime Value Report
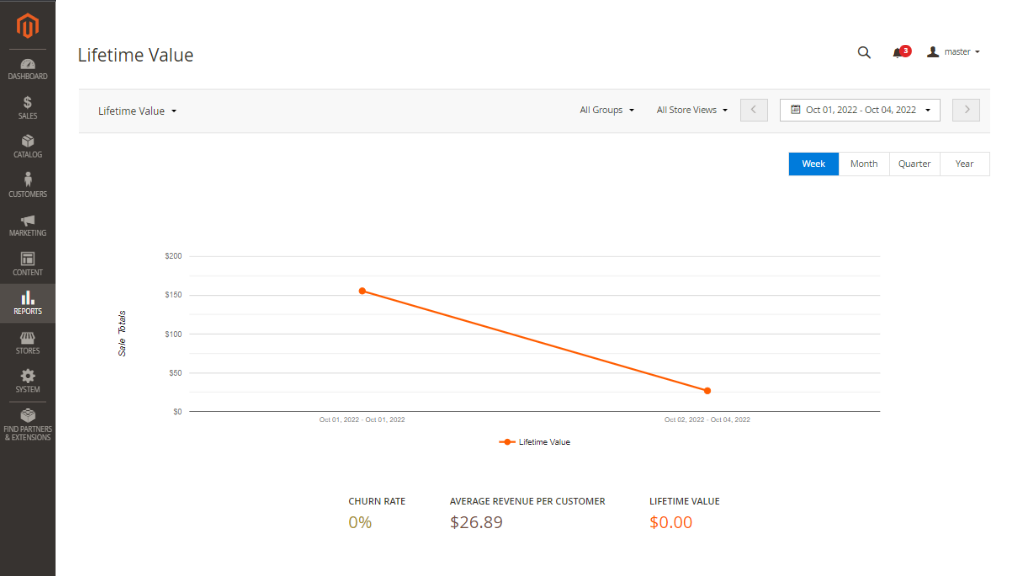
The pillar of any subscription business is customer retention. It’s a well-known fact that the longer the subscription lasts, the more value/revenue you can get from them. Lifetime Value (LTV) report is considered to be the most fundamental recurring revenue report, as it shows the total revenue you earn from a customer.
In the Lifetime Value report you can find the following metrics: Churn Rate, Average Revenue per Customer and Lifetime Value. Store admins can specify date, customer group and store view for better segmentation.
Analytics Dashboard
You can quickly overview subscription analytics in one place with Analytics Dashboard. For it, go to Reports > SARP 2 Reports by Aheadworks > Dashboard.
Here you can check total subscriptions, new, churn, churn rate, initial orders, recurrent orders, total revenue, initial invoiced and other metrics. In this way you can overview all subscription business statistics without opening too many tabs and getting deeper into each report. However, if you want to see more information, you can do it right from the Dashboard by clicking View Report next to the chosen metrics.
Besides, there’s an opportunity to set which metrics to show. For it, click the tab name and select what data you want your dashboard to display.

To Conclude
It’s important to gain valuable information about your subscription business performance to make data-driven decisions and build an efficient sales strategy. For it, you will need M2 Advanced Subscription Products (version 2.19.0 or later) and M2 Advanced Reports. Once both extensions are installed, it’s possible to check meaningful insights about the performance of your subscription business.
Together with this valuable integration, with the release of M2 Advanced Subscription Products 2.19, an option to Disable Guest Checkout for Subscription has been added. It can be found in the General Configuration section.
Find more useful information about Advanced Subscription Products extension in the user manual.


